
1. The Role of Financial Modeling in Modern Corporate Management
If corporate management is considered an "obstacle course" journey to conquer million-dollar KPIs, then Financial Modeling is the high-end 4.0 version "compass." In its simplest terms, this is the process of building a summary of a business's expenses and income in the form of a spreadsheet. But don't confuse it with regular accounting! Financial Modeling doesn't just look at the past; it "flexes" its future forecasting capabilities, helping executives visualize the financial outlook of every decision—from M&A (mergers and acquisitions) and fundraising to launching a new product line.

Despite dozens of flashy SaaS (Software as a Service) platforms emerging every day, Excel still maintains its "OG" (Original Gangster) status in the financial world. Why? Because of its absolute flexibility. A sophisticated financial expert can customize every formula and spreadsheet structure according to the "vibe" of each project without being constrained by rigid templates. Excel is not just a spreadsheet; it is a thinking language where every business assumption is "encoded" into persuasive financial scenarios.
"Financial Modeling is not just about numbers; it's about telling a logical story about the future of a business through the language of Excel."
To upgrade from a "soulless" spreadsheet to a powerful decision-making tool, the What-If Analysis toolkit in Excel is the "ace in the hole" that anyone pursuing modern office technology must master:
- Goal Seek: This is the tool for "warriors" who like to work backwards. You know your year-end profit goal is $10 million? Goal Seek will automatically calculate how much sales volume you need or how much input costs must be optimized to reach that figure.
- Scenario Manager: Life always has Plan A, B, and even Plan... "SOS." This tool helps you store and quickly switch between scenarios: Best case, Base case, and Worst case, so the business is always in a proactive position.
- Solver: If Goal Seek is the basic level, Solver is the "final boss." It helps solve complex optimization problems with multiple constraints (e.g., how to maximize profit while ensuring the marketing budget doesn't exceed 20% and staff doesn't exceed 50 people).
| Tool | Primary Purpose | Complexity |
|---|---|---|
| Goal Seek | Find input values to achieve a specific target result. | Basic |
| Scenario Manager | Compare different sets of input values (scenarios). | Medium |
| Solver | Find the optimal solution based on multiple variables and constraints. | Advanced |
Mastering financial models not only helps businesses operate more professionally but also creates a confident "demeanor" when facing investors. It is the perfect combination of sharp logical thinking and top-tier office technology, helping you not only work hard but work extremely smart.
2. Using Goal Seek to Determine Reverse Business Goals
Welcome to the "sanctuary" for those who love absolute precision! If you view Excel as a mere data entry tool, you are missing out on Goal Seek – a highly sophisticated What-If Analysis feature that carries the soul of iterative calculations. Instead of following the traditional path: Input → Formula → Output, Goal Seek allows us to perform a spectacular logical "U-turn": Expected Output → Formula → Required Input. This is the pinnacle of Reverse Engineering in financial management.
"Goal Seek is a testament to how computers can tirelessly and incredibly accurately perform Trial and Error steps for humans, helping us find the golden variable in just milliseconds."
Regarding its operating principle, Goal Seek runs on a simple yet powerful mathematical loop. It continuously changes the value of an input variable (Changing cell) until the result of the formula (Set cell) perfectly matches the goal you have set (To value). It does not predict; it searches for the exact solution within the arithmetic space you establish.

The most classic application of Goal Seek is Determining the Break-even point. Imagine you are operating a SaaS (Software as a Service) project. You have Fixed Costs for server infrastructure and personnel, along with Variable Costs per user. The question is: "How many subscribers are needed for net profit to equal 0?"
- Step 1: Set up the formula: Profit = (Selling Price - Variable Cost) * Quantity - Fixed Costs.
- Step 2: Call the Goal Seek command (Data > What-If Analysis > Goal Seek).
- Step 3: Set cell as the Profit cell, To value as 0, and By changing cell as the Number of Customers cell.
And "Boom!" – Excel will perform dozens of calculations in the blink of an eye to provide the exact figure you need. This logic is similarly applied when you want to calculate sales to reach an expected profit level. Instead of setting To value to 0, you simply enter the million-dollar figure you desire. Goal Seek will immediately return the workload or minimum selling price you must achieve to turn that dream into reality.
| Feature | Manual Trial-and-Error Method | Using Goal Seek |
|---|---|---|
| Processing Speed | Slow, dependent on human intuition. | Instantaneous. |
| Accuracy | Usually stops at an approximation. | Accurate to many decimal places. |
| Complexity | Easily discouraging with multi-layered formulas. | Smoothly handles all nested mathematical functions. |
However, as true "Geeks," we must acknowledge its limits: The weakness of Goal Seek is its single-tasking nature. It is only capable of processing a Single Variable at a time. If your business model requires simultaneously changing the selling price, marketing costs, and conversion rates to optimize profit, Goal Seek will "surrender." In that complex multi-variable scenario, we will need higher-level "monsters" like Solver or linear optimization algorithms. But for single-target problems, Goal Seek remains a streamlined and highly effective "heavy weapon" in the Office toolkit.
3. Multi-Scenario Analysis with Scenario Manager for Risk Forecasting
Never let your business fall into a passive state. In the digital era, ambiguity is the enemy of profit. Scenario Manager is not just a tool in Excel; it is a strategic roadmap that helps you see through fluctuations before they actually occur. You must master the numbers, or let the numbers control you.
"Risk forecasting is not about guessing the future, but about being prepared for every possible scenario to gain the upper hand."
To operate a disciplined and efficient financial machine, you need to set up 3 core scenarios immediately. This is the gold standard in modern risk management:
- Best Case Scenario: Exceptional revenue growth, maximum cost optimization, and the lowest borrowing interest rates.
- Base Case Scenario: The most realistic numbers, based on historical data and current market conditions.
- Worst Case Scenario: Revenue drops by 30-50%, raw material costs escalate, and interest rates fluctuate sharply.
| Assumption Variables | Best Case | Base Case | Worst Case |
|---|---|---|---|
| Revenue Growth | +20% | +5% | -15% |
| Variable Cost Ratio | 40% | 50% | 65% |
| Loan Interest Rate | 6% | 8% | 12% |
Start by navigating to Data > What-If Analysis > Scenario Manager. Here, you will assign "Changing cells" which are revenue, costs, and interest rates. Discipline in data entry is key. Every number entered must be grounded in reality, not imaginary figures to "beautify" reports.
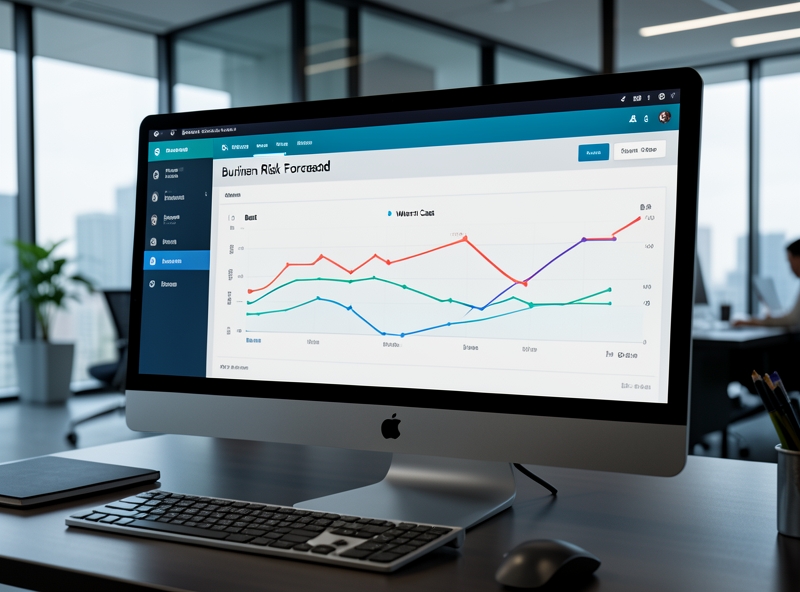
The final step, and the most powerful one: Export the Summary Report. With just one click, the system will automatically generate a comprehensive comparison table of scenarios impacting Cash flow and Net Profit. You will clearly see where your business's margin of safety lies. If the cash flow remains positive in the "Worst Case" scenario, you are on the right track. If not, you must change your strategy immediately!
Action Plan:
- 1. Identify Now: List the 3 most important variables affecting your profit this month.
- 2. Set up Excel: Open your budget file, use Scenario Manager to enter data for 3 scenarios: Best, Base, and Worst.
- 3. Analyze Report: Export the Summary Report and spend 15 minutes evaluating the impact of the Worst Case scenario on solvency.
- 4. Make Decisions: Based on the report, adjust your cost contingency plan within the next 24 hours.
4. Optimizing Resources and Profits with the Solver Tool
In my journey observing human movement, from nomadic tribes in Central Asia to office skyscrapers in Singapore, I have noticed a consistent thread: the desire to find absolute balance in a finite world. If Goal Seek is like a simple bargain at a highland market—where you change only one variable to reach a desired price—then Solver takes on the appearance of a wise elder, who must balance food, water, and the strength of the entire caravan to cross the desert. Solver does not just solve a single unknown; it addresses an entire ecosystem of complex problems.
| Comparison Features | Goal Seek | Solver |
|---|---|---|
| Number of variables | Only one changing cell (Variable). | Multiple variables changing simultaneously (Up to 200 variables). |
| Constraint conditions | None. | Ability to set limits (Greater than, less than, integers...). |
| Problem objective | Find a specific value. | Find the optimal value (Max, Min) or a specific value. |
To operate this optimization "machine," office professionals need to think like an architect planning an ancient city, where every brick laid must account for the terrain and feng shui. The structure of Solver is based on three main pillars:
- Set Objective: This is your ultimate destination—it could be maximizing profit during a peak tourism season or minimizing the operating costs of an agricultural supply chain.
- By Changing Variable Cells: The factors you have the power to adjust, such as the number of employees, the amount of input raw materials, or the capital allocation weights across different stocks.
- Subject to the Constraints: These are the real-world boundaries that we cannot cross. They include maximum budgets, finite machinery capacity, or humane labor safety regulations.

The practical application of Solver is like weaving an exquisite brocade from loose silk threads. In production problems, Solver helps businesses accurately determine the quantity of each item to produce to maximize the use of leftover materials and avoid waste—an action that I believe carries the beauty of respecting natural resources. In the financial sector, it helps investors with Portfolio Allocation to minimize risk while maintaining enough profit to preserve heritage value for future generations.
"Optimization does not lie in possessing everything, but in arranging what we have in their rightful places to create the most harmonious whole."
Using Solver is not just a pure office informatics skill; it is a philosophy of life. When we learn to set constraints scientifically on a spreadsheet, we simultaneously learn to accept and overcome the limits of reality to find the shortest path to sustainable prosperity.
5. 5-Step Process for Building Professional Financial Models and Controlling Errors
Doing finance in the digital age is no longer about "heavy," greyish spreadsheets riddled with risks. For a true Gen Z, a standard Financial Model must achieve two criteria: a professional "Vibe" with a clear structure and a solid "Core" for absolute error control. Let's "unbox" the 5-step process to transform lifeless numbers into a flexible forecasting system that helps you "flex" your data skills in front of even the toughest bosses.
To begin, we need to master the divine "tripod" structure: Inputs, Calculations, and Outputs. Separating these three parts helps your model avoid "spaghetti code" – where formulas and data intertwine into an uncontrollable mess.

Step 1: Set the "DNA" for data (Inputs). Never hard-code numbers directly into calculation formulas. Create a separate sheet for all assumptions such as growth rates, variable costs, interest rates... This allows you to change the entire forecast scenario in just 1 second without having to backtrack to find errors.
Step 2: Build the engine (Calculations). This is where the "behind the scenes" calculations take place. Keep formulas as simple as possible. If a formula is longer than 3 lines, it's a sign you need to break it down. Use techniques like Named Ranges to make reading formulas as easy as reading a status update on social media.
Step 3: Show up with impressive results (Outputs). A flexible forecasting system is a combination of the "Power Trio": Excel (deep logic processing), Power BI (artistic data visualization), and AI/Python (complex scenario analysis). Outputs should be highly interactive Dashboards, helping viewers immediately see the big picture of cash flow and profit.
| Feature | Traditional Model (Manual) | Professional Model (Systematic) |
|---|---|---|
| Data Structure | Chaotic, hard to retrieve | Separated Input - Calc - Output |
| Scenario Capability | Must edit each formula | Change 1 variable, update everything |
| Error Control | Manual visual check | Automated Error-check system |
Step 4: Establish a "Skin-care" system for data (Data Integrity). To keep the model from "breaking" midway, data integrity is vital. Use Data Validation to limit the type of data entered and Conditional Formatting to highlight anomalies as soon as they appear.
Step 5: Error Control and Stress-test. This is the step to prove your level. Build a dedicated "Check-sum" tab to check the balance of the balance sheet or cash flows. If total assets minus total equity and liabilities do not equal 0, the system will warn you with a bright red color.
"A financial model without an error-checking system is like driving a supercar without brakes. The speed might be fast, but the risks are unpredictable."
Finally, always remember the golden rule: Always have a Documentation log of the model's logic. This not only helps others understand the brainpower you put in but also keeps you from "freezing up" when reopening the file after 3 months of not touching it.
6. Summary
Mastering Excel modeling techniques goes beyond software skills; it is essentially the process of building a system of logical thinking and structured problem-solving. In the flow of modern office technology, despite the emergence of many specialized AI and Business Intelligence platforms, Excel maintains its position as the "lingua franca" of management. Its core value lies in its infinite customization, allowing users to transform raw data into highly practical business scenarios that directly serve strategic decision-making.
"An excellent financial model does not reside in the most complex formulas, but in the ability to most accurately reflect business reality through simple and transparent logic."
To enhance financial analytical thinking, regular practice is an irreplaceable factor. Reality shows that analytical thinking does not come from understanding theory, but is formed through the process of directly solving error margins and optimizing data structures. Professionals who maintain a habit of refining models weekly are often able to detect potential risks in balance sheets 35% faster than those who only use existing templates.

In particular, the accuracy of business forecasts depends entirely on the quality of input data. A model, no matter how perfect its architecture, will become worthless if based on outdated assumptions. Establishing real-time data update mechanisms helps the model "live" with the heartbeat of the market. This ensures that variables regarding costs, revenue, and cash flow are always reflected most faithfully, thereby minimizing the deviation between planning and execution.
- Core Value: Transforming data into concrete business strategies.
- Practice: Building logical reflexes and sensitivity to numbers through practical application.
- Accuracy: Depends on integrating real data and continuously updating variables.
Ultimately, office technology is a tool, but analytical thinking is an asset. Investing in Excel modeling techniques is an investment in the ability to adapt and maintain a competitive advantage in a volatile economic era.