1. Overview of Challenges in Modern Resource Management and Project Scheduling
80% of projects fail not because of a lack of ideas, but because of resource depletion before reaching the finish line. In a business environment with dizzying speeds of change, managing projects with manual Excel spreadsheets or fragmented systems has become a silent "death sentence" for business productivity. Managers constantly fall into the trap called the "allocation paradox": a few key personnel shoulder 150% of performance leading to burnout, while others have surplus capacity but are not utilized effectively.
The immediate consequence is a ruthless domino effect. One delayed link drags the entire system down. Losing control of the schedule not only damages brand reputation but also directly erodes the business's profit margins. To survive, organizations need a new management mindset, where human and time data must be visualized in real-time.

That is why ClickUp emerged as a breakthrough office technology platform, redefining how high-performing teams operate. Instead of forcing businesses to adapt to the tool, ClickUp provides a highly customizable ecosystem, completely solving the resource and schedule management problem through its duo of core features:
- Workload Feature (Resource Capacity Management): Allows precise measurement of each member's working capacity based on working hours, number of tasks, or effort points. Managers can easily detect who is overloaded to reallocate tasks instantly with intuitive drag-and-drop actions.
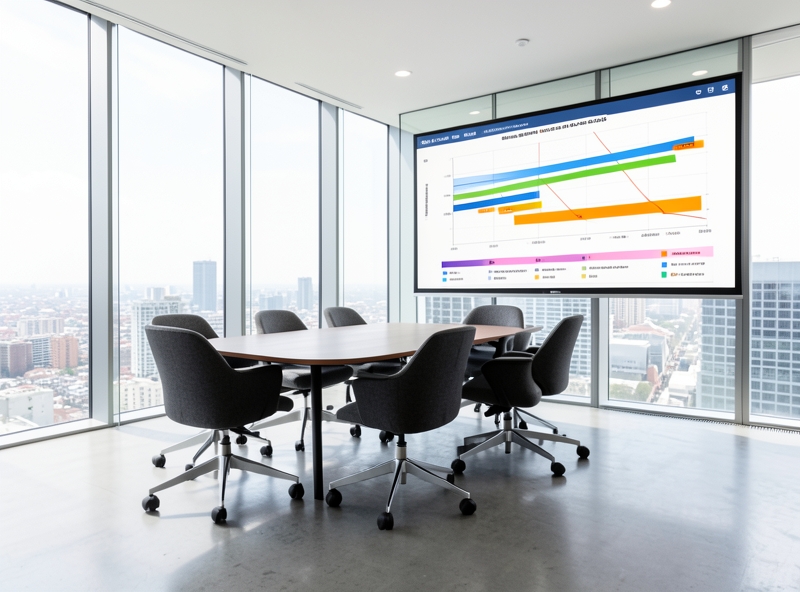
- Gantt Chart Feature (Visual Schedule Chart): Paints a panoramic picture of the project roadmap, clearly establishing dependencies between tasks. When a task is rescheduled, all related links automatically update, completely eliminating the risk of schedule conflicts.
"Modern project management is no longer about pushing staff to work more hours, but the art of smart distribution so that all resources are operated at their optimal state."
2. Setting Up the Workload Dashboard on ClickUp to Optimize Workload
A manager's biggest nightmare is not a lack of staff, but rather asymmetric distribution: the team carrying members burn out and submit resignation letters, while other employees are at ease due to a lack of tasks. When you cannot quantify each person's "capacity", you are managing by intuition. The Workload Dashboard on ClickUp is the X-ray glass that helps you see through the entire staffing picture, digitizing work capacity into visual indicators to make accurate allocation decisions.
"Do not manage people with suspicion or camera surveillance. Manage their work with actual capacity data."
To build the most optimal work dispatch center, follow the in-depth setup process below:
Step 1: Initialize the Workload Widget on the Dashboard
Go to the Dashboards section on the left navigation bar of ClickUp. Choose to create a new Dashboard or add a Widget to an existing board. Click Add Widget, search for the keyword Workload, and select this widget. This will be where the workflow of the entire department is displayed in a visual Timeline format.
Step 2: Configure Capacity Indicators for Each Member
ClickUp allows you to measure the workload limit of personnel using two core methods. Choosing the right method determines 90% of the system's success:
| Measurement Method | How It Works & Configuration | Best Suited For |
|---|---|---|
| Time Estimate (By Hours) | Assign an estimated completion time for each Task. Set standard weekly working hours for personnel (e.g., 40 hours/week, equivalent to 8 hours/day). | Service projects (Agency), software development, consulting, or highly volatile work requiring hourly billing calculations (Billable hours). |
| Task Count (By Number of Tasks) | The system automatically counts the number of assigned tasks without requiring time estimates. Set a maximum limit on the number of tasks a staff member can handle simultaneously (e.g., max 5 tasks/day). | Repetitive operations teams (Operations), Customer Service, Content Editing, or processes that are already evenly standardized in difficulty. |
After choosing the appropriate method, proceed to enter the Weekly Capacity parameters individually for each person. ClickUp is extremely flexible as it allows you to customize the capacity for specific individuals. For example: Full-time staff have a time budget of 40 hours/week, while Part-time staff or Interns only have 20 hours/week.
Step 3: Identify Overload and Adjust with Drag-and-Drop
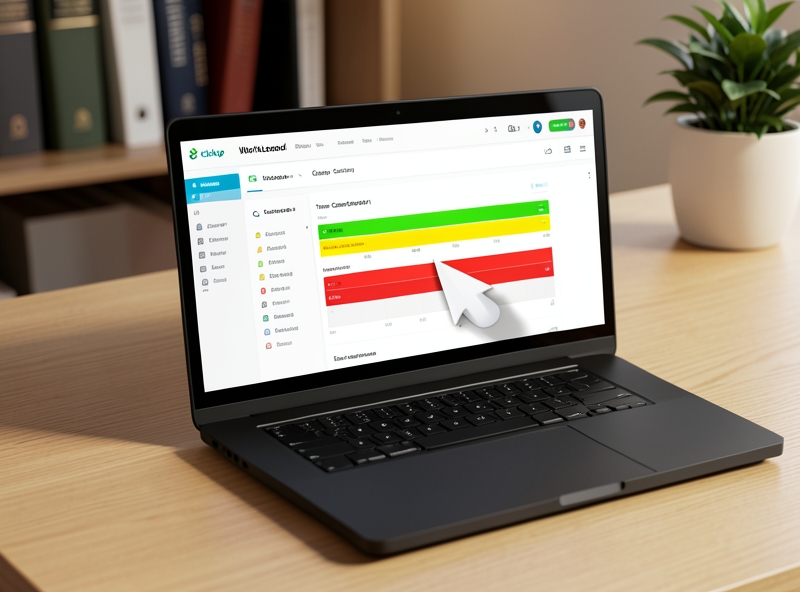
Once the data is synchronized, the Workload Dashboard will display capacity bar charts coded with smart color bands:
- Green (Under or At Capacity): Personnel are working within the safe zone, with a well-fitted workload.
- Red (Over Capacity): Urgent warning! Personnel are overloaded, posing a high risk of schedule delays or reduced output quality.
- Gray/Light (Under-allocated): Personnel have not fully utilized their performance, and more tasks need to be added.
To resolve overloading, you do not need to open each Task to change the assignee or edit the Due Date manually. Right on the visual interface of the Workload Widget, you only need to perform a drag-and-drop action to shift the task bar from the red band of the overloaded staff to the gray band of the free staff, or stretch the task bar to extend the processing time. Instantly, ClickUp will automatically update the new assignee and due date information across the entire system.
3. Applying the Gantt Chart to Control Schedule and Dependencies
One delayed link, and the entire project collapses like a house of cards. This is the classic nightmare of every manager running projects with static Excel spreadsheets or fragmented to-do lists. When you cannot see the dependencies between tasks, you are completely blind to bottlenecks until it is too late.
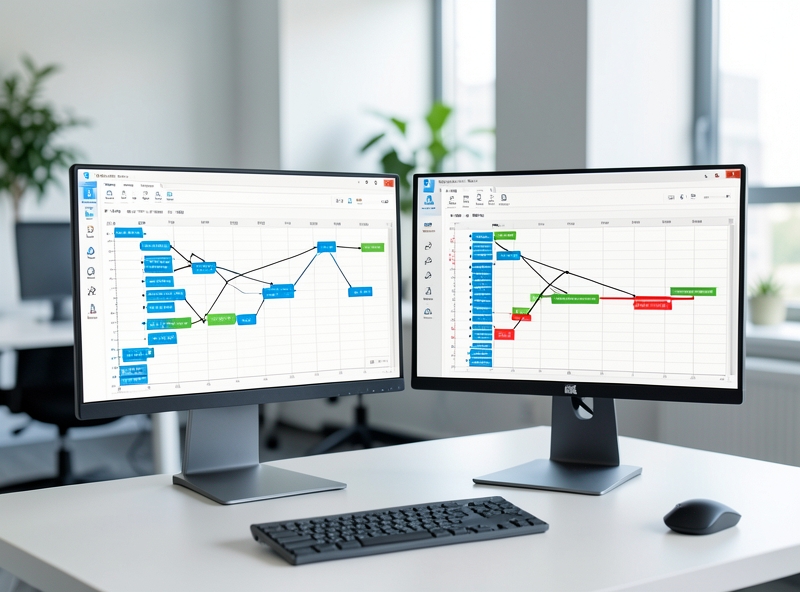
The Gantt chart visualizes the entire workflow, turning raw, dry data into a highly dynamic roadmap. By applying the ClickUp Gantt Chart, you are not just managing tasks but directly controlling a smart, automated scheduling system.
Guide to Setting Up and Optimizing Gantt Charts on ClickUp
To turn your Gantt chart into the ultimate schedule control "weapon," follow this standardized 4-core-step process:
- Step 1: Initialize and Group Smartly (Group By): In your ClickUp project space, click on + View and select Gantt. To optimize visibility, use the Group by List or Group by Assignee feature. This helps you immediately identify who is overloaded or which phase has the highest density of work.
- Step 2: Set up Dependencies using Drag-and-Drop: In ClickUp, simply hover your mouse over the start or end of a task progress bar, hold, and drag the connector line to the next task. Set up "Blocking" (This task must be completed before that task can start) or "Waiting on" relationships to completely eliminate personnel overlap.
- Step 3: Activate the Critical Path to Protect Milestones: Click on the Path (Critical Path) icon in the top corner of the ClickUp Gantt toolbar. The system will automatically calculate and highlight in red the chain of tasks that directly affect the project completion date. These are tasks that cannot be delayed by even a single day. In parallel, convert key deliverables into Milestones (Diamond icons) to create focal points for the entire team.
- Step 4: Enable Reschedule Dependencies: Go to the Gantt View settings and enable "Reschedule Dependencies". Now, when Task A (in a dependency chain) is delayed by 2 days due to an issue, all subsequent tasks B, C, and D will automatically shift accordingly in real time. You no longer have to spend hours manually editing dates for each minor task.
"A Gantt chart is not just a tool to plot schedules; it is the survival map for every project manager, where the Critical Path is the line between success and crisis."
| Comparison Criteria | Traditional Management (Excel/To-do list) | Automated Gantt Chart (ClickUp) |
|---|---|---|
| Handling delays | Manually edit each line, easy to miss items and cause schedule conflicts. | Auto-reschedule the entire chain of related tasks. |
| Identifying project risks | Only detected after the incident has already occurred. | Critical Path provides early warnings of bottleneck tasks. |
| Tracking key milestones | Text notes, easily drowned out among hundreds of rows of data. | Visual Milestones highlighted on the timeline, easy to follow. |
Applying visual management thinking through Gantt charts helps businesses cut up to 80% of meeting time for progress updates. Every member clearly knows how their work affects their teammates, thereby automatically optimizing work performance without the need for constant pushing from managers.
4. Coordinating Workload and Gantt Chart: The Formula to Double Team Performance
Most managers have fallen into this trap: Drawing a picture-perfect Gantt chart with flawless timelines, yet the project still collapses at the last minute. The reason is simple: You only see the progress of the work while being completely "blind" to the actual capacity of your staff. Planning with Gantt while ignoring Workload is like mapping out a long road trip without ever checking the car's fuel tank.
The synchronized combination of Gantt Chart and Workload in modern office technology platforms is the answer to the resource optimization puzzle. When these two elements "meet," managers gain a comprehensive perspective: Who is doing what, for how long, and whether they are being overloaded. Task assignment decisions are no longer based on intuition, but on real-time data displayed right on the screen.
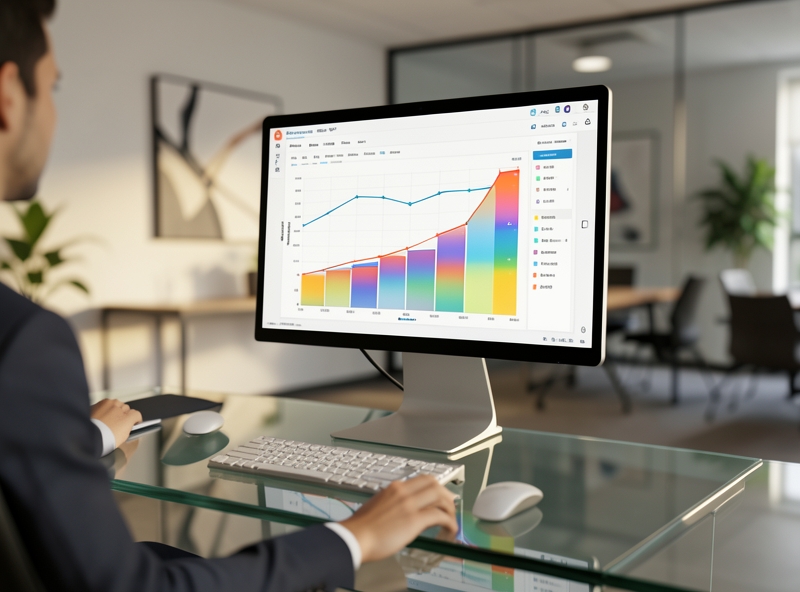
To clearly see this revolutionary difference, let's compare the traditional management method with technology-integrated management:
| Comparison Criteria | Using Gantt Independently (Traditional) | Integrating Gantt + Workload (Modern) |
|---|---|---|
| Resource Allocation | Assigning tasks based on guesswork, easily leading to a situation where "some are idle while others are overwhelmed." | The system automatically triggers a red alert when a staff member is overloaded (exceeding 8 working hours/day). |
| Handling Changes | Manually stretching the timeline, causing chain-reaction disruptions and schedule conflicts. | Drag and drop timelines on Gantt, and the system automatically recalculates and updates each individual's task chart. |
| Basis for Decision Making | Based on subjective weekend or end-of-month reports from employees. | Visual data in real-time (Real-time dashboard), allowing immediate intervention when bottlenecks are detected. |
"The pinnacle of management is not exhausting your best talent, but distributing pressure evenly so that every cog in the machine operates in an optimal state."
A real-world scenario: An unexpected project from a major client arises right in the middle of an operational cycle. Typically, a manager's reaction would be to push the work onto the department's "star" employee. The result? Key personnel become overloaded and resign; the new project is delayed, and existing projects fall apart. With modern office technology, you handle this crisis in just 3 data-driven steps:
- Step 1: Resource Scanning: Open the Workload interface to filter out personnel who have free capacity (under-allocated) in the coming week, instead of just reflexively assigning it to familiar faces.
- Step 2: Run a Trial Scenario (What-if Scenario): Drag and drop the new task onto the master Gantt chart as a test. The system will immediately calculate the additional time required and warn you if there are any schedule conflicts between the old and new projects.
- Step 3: Dynamic Reallocation: Share the less critical tasks of overloaded staff with those who have more free time. All progress updates will automatically send real-time notifications to each individual's device.
Applying technology to synchronize Gantt and Workload is not just about updating work tools. This is a strategic transition that helps businesses completely eliminate wasted time, protect the mental health of the team, and most importantly: Ensure all timeline commitments to clients are executed with the utmost precision.
5. Conclusion
Data doesn't lie, but manual progress reports can paint a picture of "fake busyness." Many managers are still falling into the trap of running a business by feel: seeing employees typing away furiously but projects are still delayed, seeing every department complaining about being overloaded but revenue doesn't break through. Implementing advanced ClickUp is not merely changing a management software, but a revolution to completely eliminate "blind spots" in resource and progress management.
ClickUp transforms all of a business's intangible resources into visual metrics. When the capacity of each employee is accurately measured by the Workload index, every task assignment decision is based on science rather than intuition. You will put an end to the situation of some people being overloaded while others have nothing to do, while controlling the risk of delays early on thanks to the automated progress warning system.
| Comparison Criteria | Traditional Management (Chat & Spreadsheet) | Advanced Management with ClickUp |
|---|---|---|
| Resource Allocation | Task assignment based on intuition, easily causing localized overload. | Automatically balance workload (Workload View) in real-time. |
| Progress Control | Manual Q&A, static reports, easily reactive when issues arise. | Dynamic updates via Gantt Chart and Mind Map, accurately predicting bottlenecks. |
| Transparency | Fragmented information across multiple chat apps and emails. | A Single Source of Truth for the entire process. |
To start standardizing processes and optimizing your team's productivity today, managers need to execute three core actions immediately:
- Standardize process thinking before touching the tool: Do not rush to configure ClickUp when your actual process is still messy. Clearly map out the workflow, define who is responsible (owner), and the output standards for each step before putting it into the system.
- Build a "ClickUp-first" culture: If a task does not exist on ClickUp, it does not exist. Completely eliminate the habit of assigning work via personal chat apps to centralize all discussion threads, documents, and deadlines right inside the digital workspace.
- Use data for continuous improvement: Every week, spend 15 minutes reviewing the performance Dashboard. Look at metrics like average completion time (Lead time) and delay rates to continuously refine processes, rather than just using the tool to monitor employees.

"Technology is only a supporting tool, but an outstanding tool operated by a precise management mindset will create unlimited productivity leverage for the business."
Don't let your team continue to waste energy on endless progress report meetings or arguments about who is doing what and when it will be done. Setting up an optimized ClickUp system is the strategic step to turn your office into an automated, precise, and highly efficient operating machine.